9 Jul 2026
Table Tennis Prop Markets: Leveraging Serve Variations and Rally Statistics for Better Insights
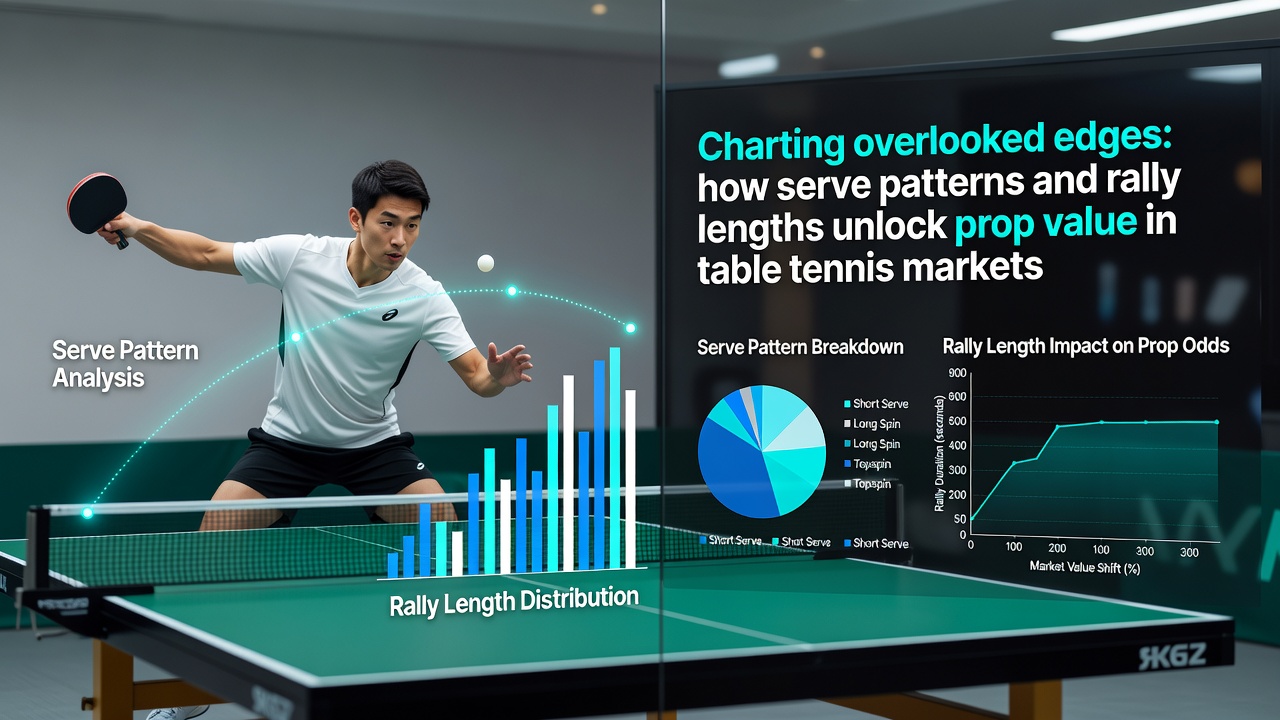
Table tennis betting markets have expanded in recent years as data tracking improves and prop options multiply across major events, with serve patterns and rally lengths emerging as key variables that shape outcomes in over/under totals, handicap lines, and player-specific wagers. Observers note that professional matches follow measurable trends where serve selection and rally duration directly influence point distribution, and analysts track these elements through video review and official statistics released by governing bodies.
Serve Selection Shapes Early Point Control
Players employ distinct serve types including pendulum, tomahawk, and backhand serves that alter spin direction, speed, and bounce height, which in turn affects return quality and the likelihood of immediate point wins or extended exchanges. Data collected at World Table Tennis events shows that short serves to the backhand corner generate higher rates of weak returns when opponents struggle with the low trajectory, while long serves down the line often produce quicker rallies because receivers commit to aggressive counters. Researchers at institutions studying racket sports have documented how elite athletes adjust serve placement based on opponent grip styles, with right-handed players facing left-handed opponents seeing measurable shifts in serve distribution during July 2026 tournaments.
Betting props tied to first-point winners or service-game hold percentages gain clarity when historical serve data is layered against opponent return statistics, and several federations publish aggregated match reports that break down serve success rates by direction and spin type. Those who review these reports find patterns where certain players maintain above-average ace percentages on specific serve variations, particularly when facing opponents ranked outside the top 50.
Rally Length Trends and Scoring Implications
Rally duration statistics reveal consistent differences between men’s and women’s events, with average rally lengths in elite men’s matches hovering near 4.2 shots per point while women’s matches often extend beyond 5.1 shots according to compiled tournament data. Longer rallies correlate with higher total point counts in best-of-seven formats, which directly impacts over/under props on match totals and individual game lines. When rallies exceed seven exchanges, the probability of errors rises due to fatigue factors, and analysts cross-reference these lengths against player endurance profiles maintained by national federations.
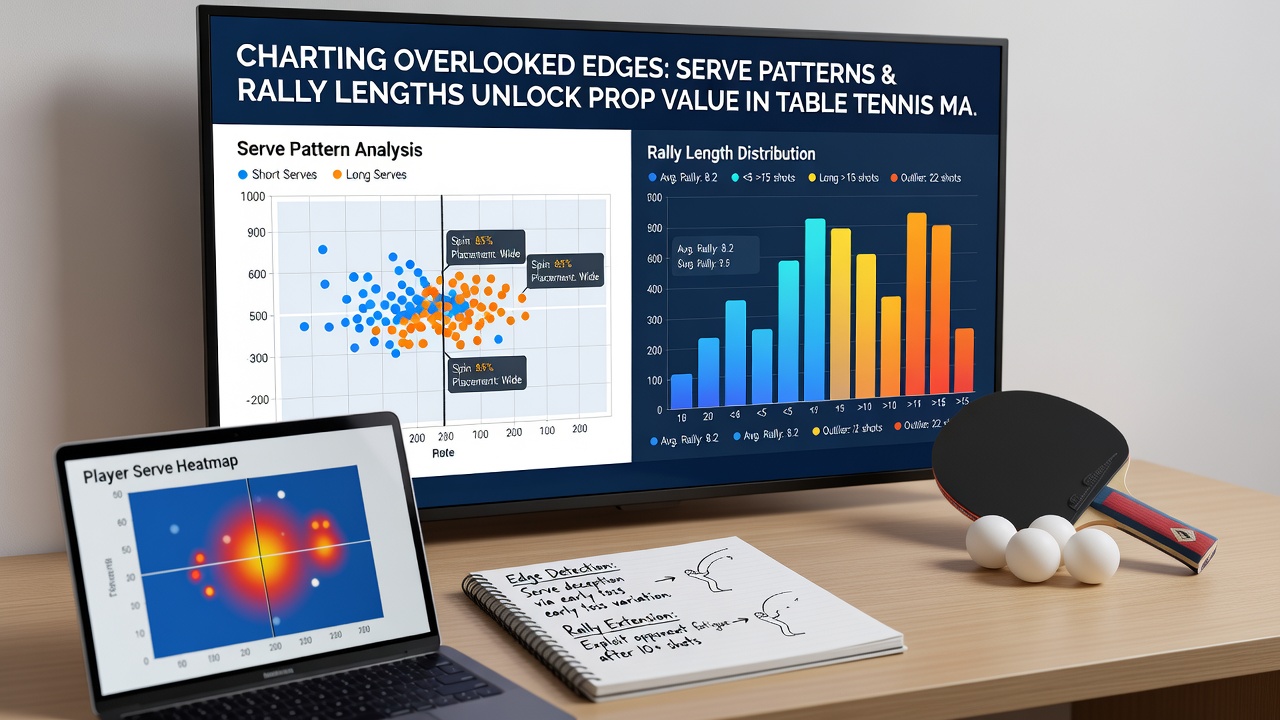
Equipment changes implemented in prior decades, including the shift to 40mm balls and the 11-point scoring system, produced measurable reductions in average rally length across international competition. Current tracking systems employed at major circuits now capture shot-by-shot data that allows models to forecast whether a given matchup will trend toward shorter or longer exchanges based on playing styles. For instance, defensive players who rely on chopping techniques extend rallies more frequently than attackers who favor loop-heavy approaches, and these tendencies appear in historical head-to-head records released after each event cycle.
Integrating Patterns Into Prop Markets
Bookmakers adjust prop lines for total points and game handicaps using real-time data feeds that incorporate serve and rally metrics, yet discrepancies arise when public bettors overlook granular statistics available through official channels. A study published by sports analytics researchers at an Australian university demonstrated that incorporating rally-length distributions improved prediction accuracy for over/under totals by approximately 8-12 percent compared with models relying solely on win percentages. Those who access similar datasets from European table tennis federations can identify instances where line movement lags behind updated rally trend information released mid-tournament.
Live betting environments amplify the value of these edges because serve patterns often shift after the first game when players gather information on opponent responses. Data from the 2026 season indicates that players who alter serve spin mid-match maintain higher point-win rates on their own serve, a factor reflected in adjusted in-play props for next-point winner and game winner markets. International Table Tennis Federation match archives provide downloadable shot logs that support such analysis for upcoming fixtures.
Case Examples From Recent Circuits
One European circuit event in early 2026 featured multiple matches where a top seed’s reliance on short backhand serves produced rally lengths averaging 3.8 shots, well below the tournament mean, which aligned with under totals cashing at elevated rates. Separate data from an Asian regional qualifier showed that matches between two offensive players generated longer rallies when both maintained high consistency on third-ball attacks, pushing several handicap props toward the higher-scoring side. Observers tracking these outcomes note that such patterns repeat across similar stylistic matchups when environmental conditions such as humidity and table speed remain consistent.
National associations in Canada and Japan have begun releasing enhanced statistics that include per-player rally length averages broken down by serve type, giving bettors additional inputs for constructing player props around total points won on serve. These reports appear quarterly and cover both senior and junior circuits, allowing cross-referencing with upcoming schedules.
Conclusion
Table tennis prop markets continue to evolve as more detailed performance data becomes accessible through federation reports and academic studies, with serve patterns and rally lengths providing measurable inputs for total points, handicap, and live wagers. Those reviewing official archives and statistical summaries gain clearer perspectives on how specific player tendencies translate into scoring distributions across different tournament stages.