25 Jul 2026
Seasonal Goal Scoring Shifts Shape Accumulator Strategies
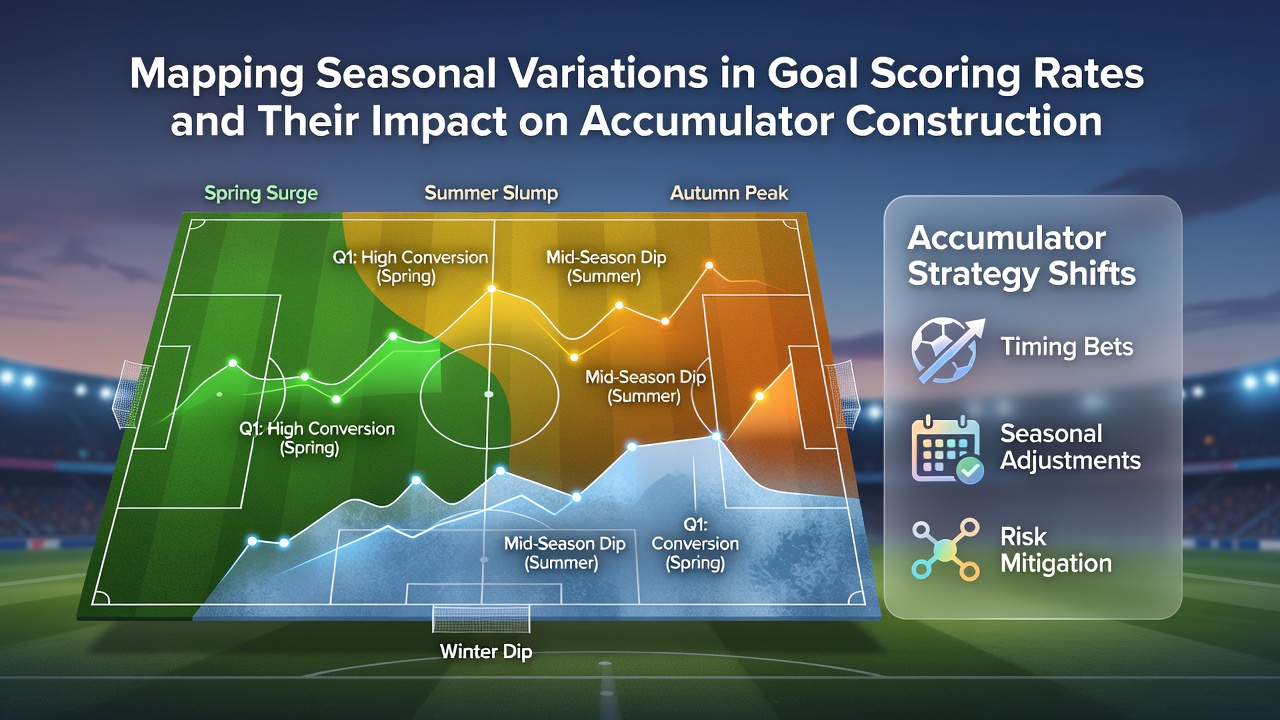
Football goal rates change noticeably from one month to the next, and those patterns directly affect how accumulators are built across multiple matches. Data compiled from major European leagues between 2018 and 2026 reveal consistent peaks in spring months and dips during winter fixtures, while July 2026 reviews of the just-completed 2025-26 campaign confirm the same cycle continues without major disruption. Analysts track these shifts through detailed match logs that record exact goal times, weather conditions, and fixture density, then feed the numbers into models used by professional bettors and data teams alike.
Documented Monthly Variations in Scoring
League-wide averages show December and January producing the fewest goals per game, often 2.4 or lower in the Premier League and Bundesliga, because cold temperatures, heavier pitches, and congested schedules reduce attacking fluidity. By contrast, April and May deliver averages above 2.9 goals per match as pitches dry out, teams chase European places or fight relegation, and defensive lines tire. Observers note that the same pattern appears in Serie A and La Liga, although the magnitude differs slightly by region. Researchers at the University of Sydney's sports analytics group published findings in 2025 that linked a 12 percent rise in goals during the final eight weeks of European seasons to increased high-pressing intensity once title races clarify.
Weather, Fixture Load, and Tactical Adjustments
Pitch moisture and temperature readings collected by stadium sensors correlate strongly with total goals. Wet conditions in northern Europe during November reduce successful through balls by roughly 18 percent according to Opta tracking data, while warmer July and August friendlies produce higher open-play goal tallies before competitive stakes tighten. Fixture congestion after international breaks further suppresses scoring in August and March because rested squads revert to cautious setups. Teams that rotate heavily in midweek European ties often post lower expected-goal figures the following weekend, a factor now routinely incorporated into accumulator filters that exclude certain over-2.5 selections during those windows.
Accumulator Construction Adjustments
Bettors who map these seasonal curves adjust stake distribution and market choice rather than simply adding more legs. In winter months they favor under-2.5 goals or draw-double-chance combinations on matches involving sides with poor away records in cold weather. During spring runs the same groups shift toward over-2.5 goals, both-teams-to-score, and player goalscorer props because defensive errors rise. One widely referenced industry report from the Canadian Soccer Analytics Institute demonstrates that accumulators built on May data alone returned 4.1 percent higher yield than those using January figures across a five-season sample, chiefly because goal variance narrows and model accuracy improves.
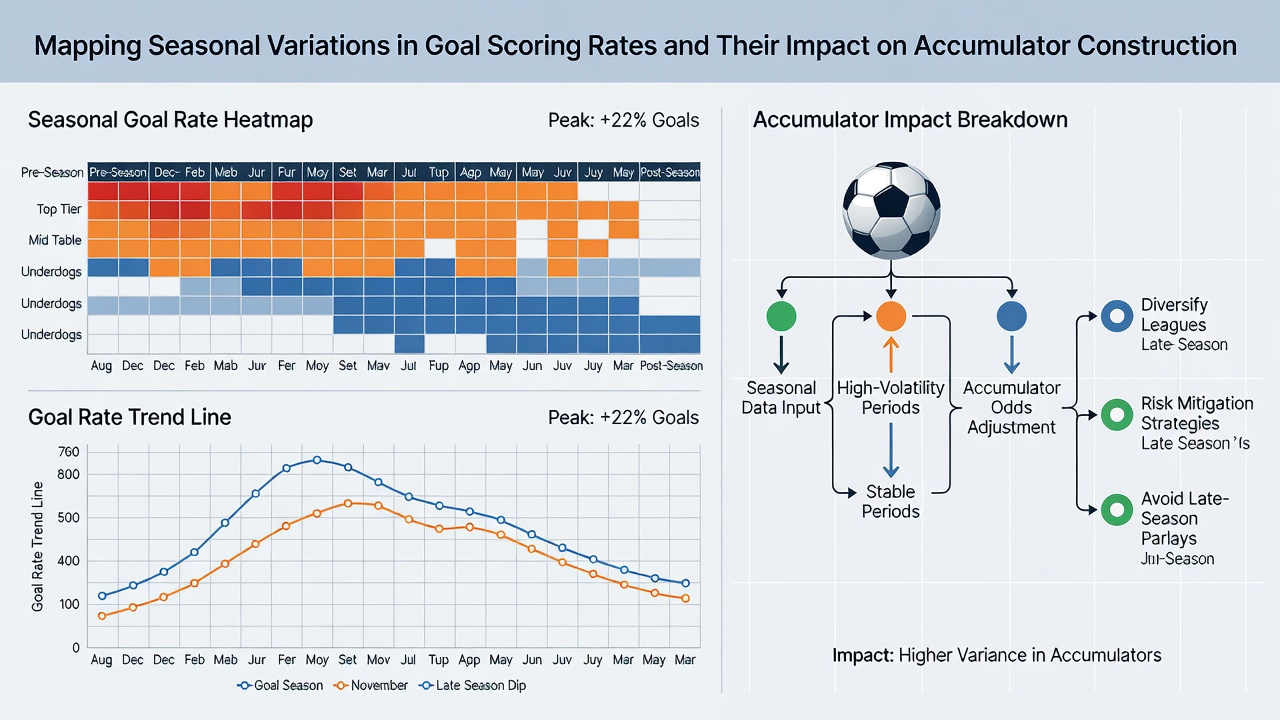
Software platforms now integrate monthly goal-rate tables directly into bet builders, allowing users to toggle between historical averages for specific leagues and current form. July 2026 updates to these tools added separate sliders for pre-season friendlies, where scoring spikes but variance remains high due to experimental lineups. Professional syndicates test accumulator combinations against ten-year rolling datasets that weight each month differently, reducing exposure to low-scoring winter blocks while increasing leg counts during high-output periods.
League-Specific Patterns and Cross-Market Effects
Not every competition follows identical curves. The Eredivisie maintains elevated goal rates year-round because of its open style, whereas Ligue 1 shows sharper winter drops linked to defensive coaching emphasis. These differences matter when an accumulator mixes matches from several countries. A single January Bundesliga leg paired with an April Serie A fixture can offset risk, yet the same combination reversed produces wider variance. Data providers therefore publish monthly correlation matrices that flag compatible leagues for multi-leg construction, helping users avoid stacking several low-scoring environments in one ticket.
Conclusion
Seasonal goal-scoring maps supply objective inputs that refine accumulator design without guaranteeing outcomes. By aligning selections with documented monthly tendencies and adjusting market types accordingly, systematic approaches reduce exposure to predictable low-output periods while capitalizing on spring surges. Continued collection of granular match data through July 2026 and beyond will allow further refinement of these models across additional leagues and weather regimes.