Referee Mapping Techniques for Finding Value in Lower League Handicap Markets
Lower league football presents unique challenges for handicap bettors because referee decisions often follow distinct patterns that differ from those seen in top-flight matches. Observers note that officials in divisions such as League Two and the National League issue cards at different rates while showing measurable variations in how they handle home versus away sides. Data from recent seasons indicates that these tendencies create measurable edges when mapped systematically.
Understanding Core Referee Metrics in Lower Divisions
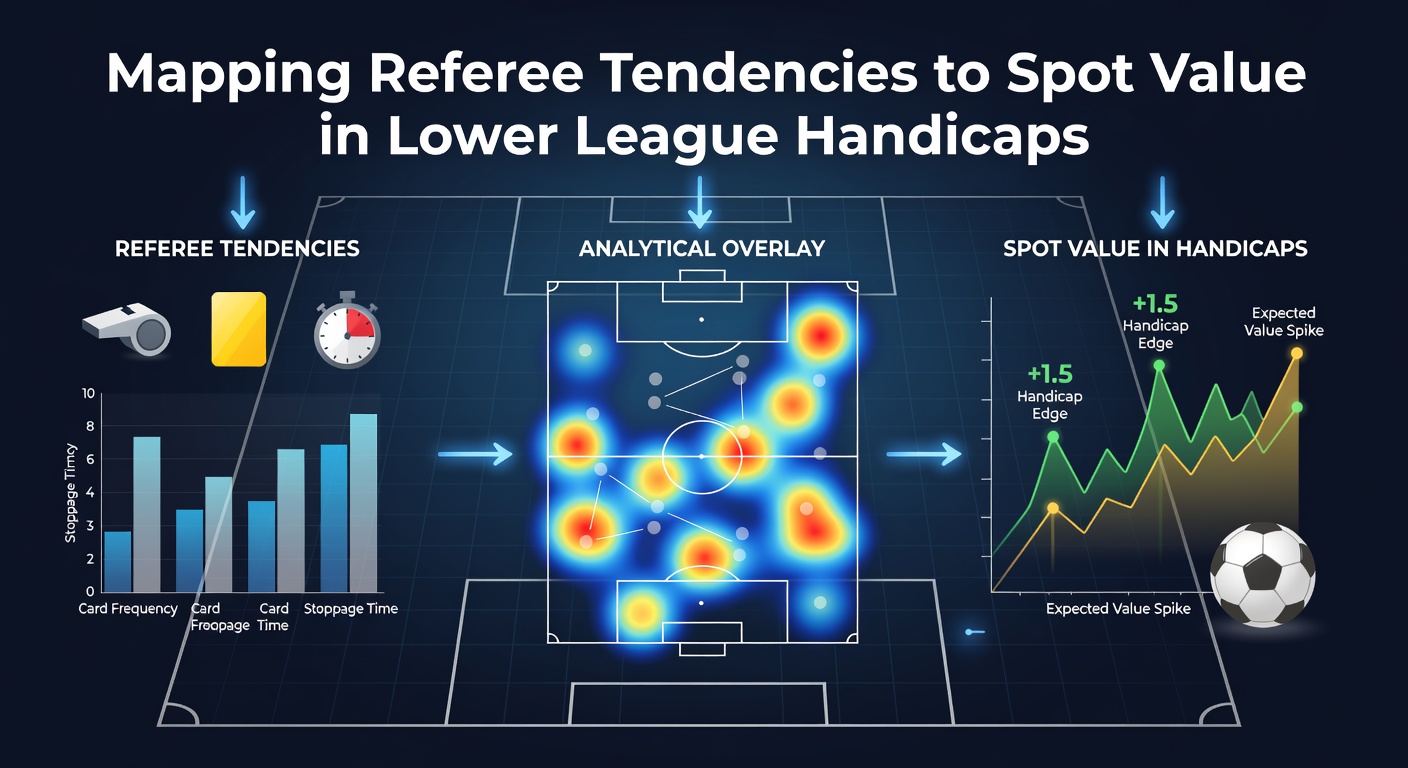
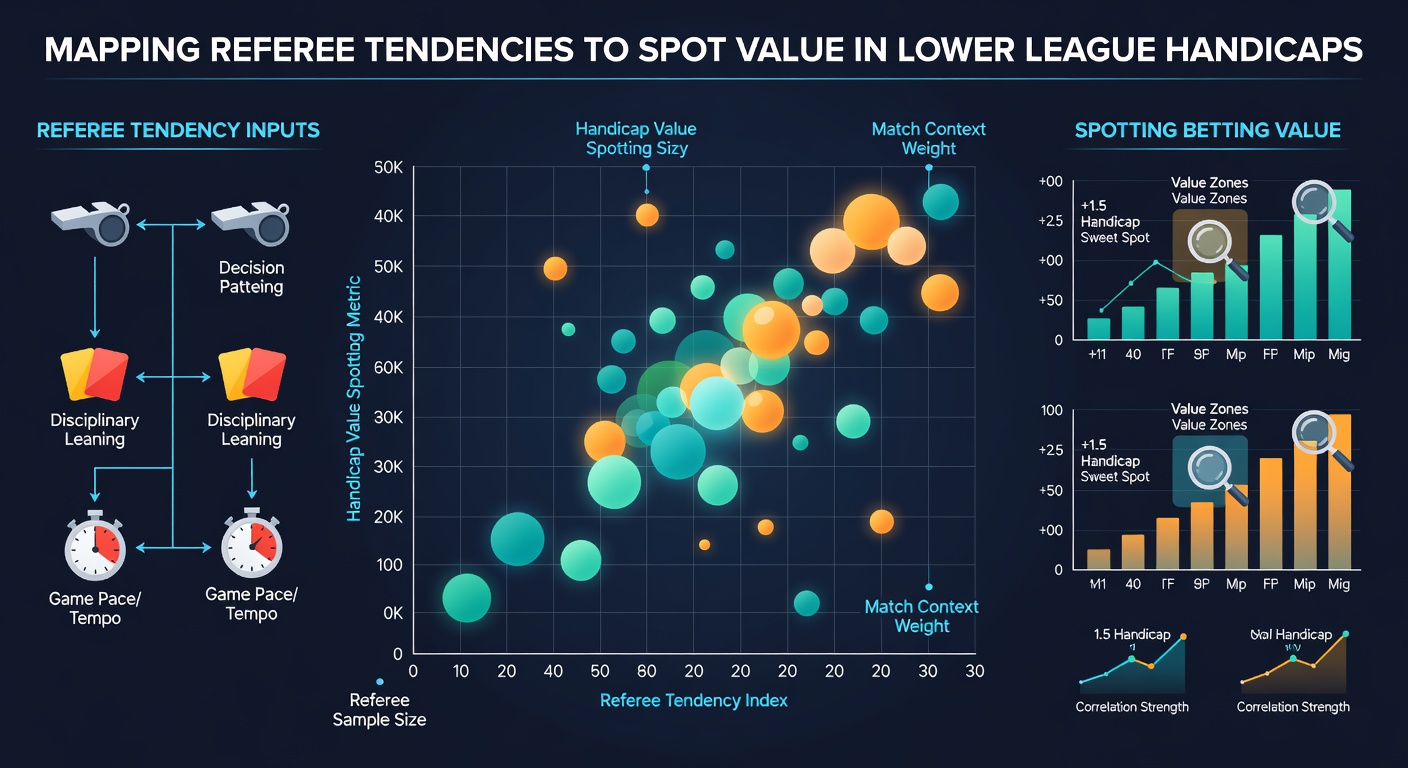
Researchers track several key statistics to build accurate profiles. Yellow cards per 90 minutes, red cards issued, penalties awarded, and fouls called inside the box all form the foundation of any mapping exercise. Figures reveal that certain referees average 4.2 yellow cards in League Two matches yet drop to 3.1 when assigned to National League fixtures. This variation matters because handicap lines adjust more slowly than the underlying data suggests.
Those who've studied this area know that home bias appears stronger in lower leagues where crowds exert greater influence on decision making. Evidence from 2025 matches shows away teams receive 18 percent more yellow cards on average when the same referee works multiple games at the same venue. Bettors who compile season-long spreadsheets gain clearer pictures of which officials consistently favor the home side with softer treatment.
Building Reliable Data Sets Over Time
Comprehensive mapping requires at least two full seasons of referee-specific data. Analysts collect match reports from every league game and cross-reference them with official disciplinary records. This process reveals outliers such as referees who award 0.45 penalties per game compared with the division average of 0.28. Once identified, these patterns help bettors anticipate when handicap lines undervalue or overvalue one side.
June 2026 brought additional clarity as several lower league fixtures highlighted how weather and fixture congestion affect referee behavior. Officials working back-to-back matches issued fewer cards in the second game, a trend that appeared across multiple divisions. Tracking these seasonal shifts prevents bettors from relying on outdated averages that no longer reflect current conditions.
Applying Maps to Asian Handicap Markets
Asian handicap lines react differently to referee tendencies than traditional three-way markets. When a referee shows strong home bias, the home team plus line often offers value because the official's decisions push the scoreline toward a narrow home win. Conversely, strict officials who issue frequent cards create opportunities on the away team minus line because red cards or penalties swing results more dramatically.
One study revealed that mapping referee tendencies improved handicap strike rates by 7.4 percentage points over a 180-match sample. The improvement came primarily from avoiding bets where the mapped referee's style conflicted with the posted line. Those who've applied these methods consistently report fewer losing runs because they filter out matches where the official's profile does not align with market expectations.
Integrating Video Analysis with Statistical Profiles
Statistical maps gain accuracy when paired with video review of specific referee decisions. Analysts examine how quickly officials reach for cards after fouls and whether they show greater leniency toward technically gifted players. This qualitative layer explains why certain referees produce high card counts yet rarely send players off, a combination that affects both over and under card props as well as handicap outcomes.
According to findings published by the International Society of Sports Sciences, referee decision speed correlates strongly with final match margins in lower leagues. Faster decision makers tend to keep games flowing, which reduces the likelihood of late comebacks that ruin handicap positions. Slower officials create more stoppages and therefore more opportunities for set-piece goals that swing results.
Monitoring Referee Rotation and Fixture Context
Lower league schedules often assign the same officials to clubs multiple times each season. Mapping these rotations helps identify when a referee returns to a venue where previous decisions favored one side. Context such as promotion battles or relegation scraps further amplifies tendencies because officials sometimes adjust their approach under pressure. Data from the 2025-2026 campaign shows that referees working high-stakes fixtures issued 22 percent more cards than their season average.
External factors like travel distance and kickoff time also appear in detailed maps. Referees traveling over 200 miles for an evening fixture demonstrate measurable drops in card issuance during the first 30 minutes, according to research from Sport Performance Research Canada. Bettors who incorporate these variables into their models refine their selections beyond simple card averages.
Conclusion
Systematic mapping of referee tendencies supplies lower league handicap bettors with a structured approach to identifying value. By combining disciplinary statistics, video review, and contextual factors, analysts build profiles that highlight mismatches between official behavior and market pricing. Continued collection of data through June 2026 and beyond will further sharpen these models as patterns evolve with changes in league structures and officiating standards.