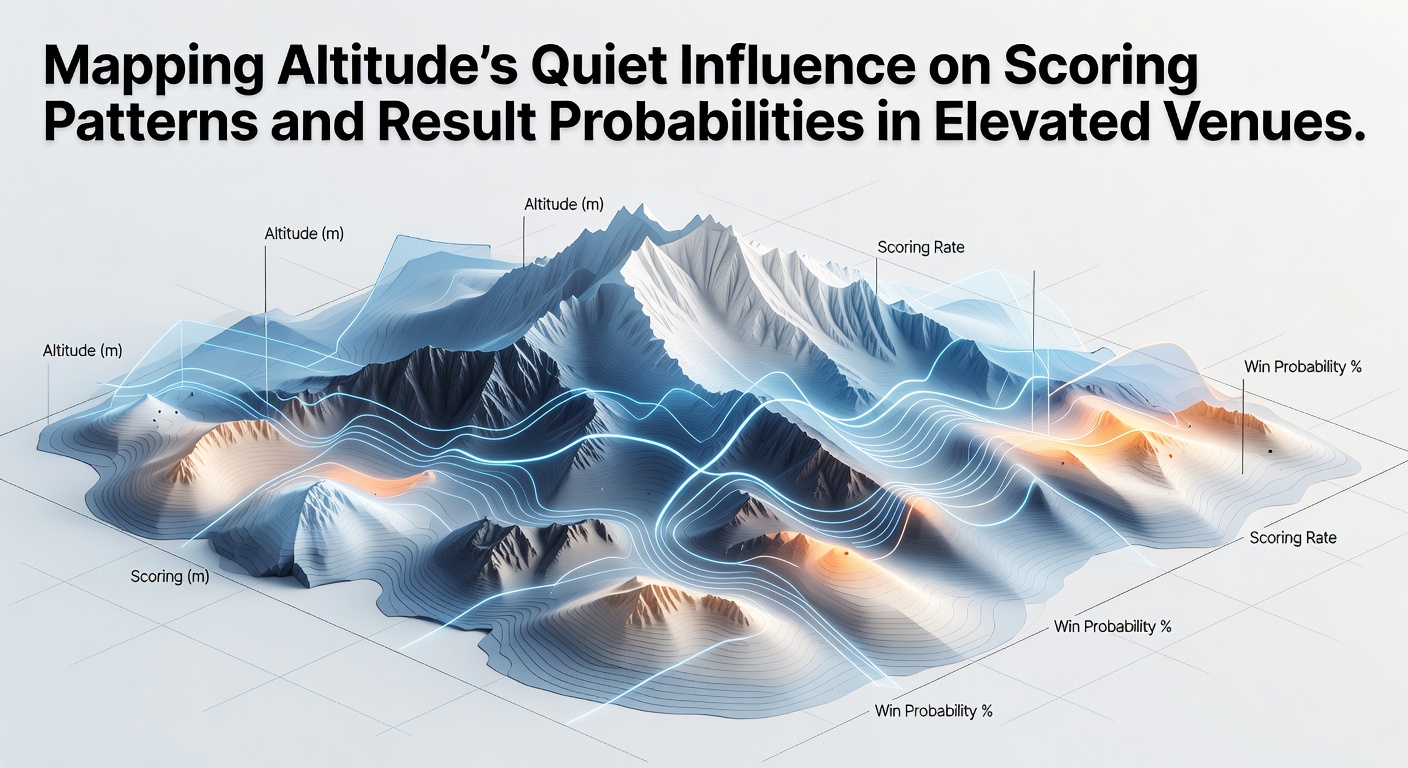
Altitude Mapping Reveals Shifts in Scoring Dynamics and Probabilistic Outcomes at Elevated Sports Facilities
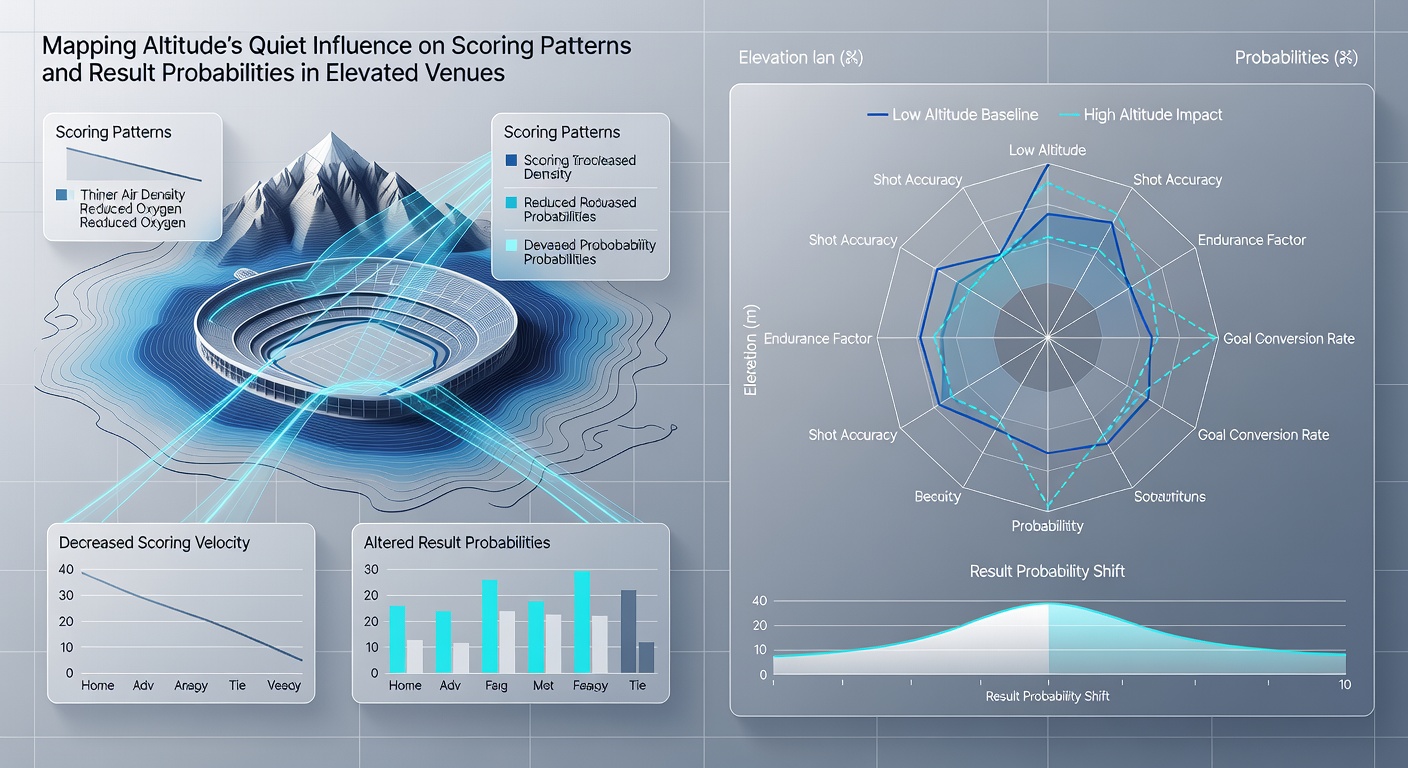
High-elevation venues alter the physics of ball flight and player endurance in measurable ways, and analysts track these changes through performance data from leagues across South America, North America and beyond. Researchers at institutions like the University of Colorado have documented how reduced air density at elevations above 1,500 meters increases projectile distances while simultaneously taxing aerobic capacity during prolonged efforts.
Studies from the 2024 season onward show that baseballs travel 8 to 12 percent farther at Coors Field in Denver compared with sea-level parks, leading to elevated run totals and adjusted betting lines on totals markets. Soccer matches in La Paz, Bolivia, at roughly 3,600 meters produce fewer goals on average because visiting squads struggle with oxygen uptake, a pattern confirmed in match logs from CONMEBOL competitions.
Physics Behind the Patterns
Lower atmospheric pressure reduces drag on spherical objects, which explains why fly balls carry farther and long passes in football gain extra meters when played at altitude. At the same time, athletes experience decreased oxygen saturation that slows recovery between sprints and reduces overall work rate after the first 30 minutes of play. Data collected by exercise physiologists indicates heart rates remain higher for longer periods, yet sprint speeds decline measurably once fatigue sets in.
These dual effects create divergent scoring outcomes depending on the sport. Baseball benefits from the carry on batted balls while football and rugby see suppressed scoring because sustained pressure becomes harder to maintain. Observers note that goalkeepers in elevated soccer venues face added difficulty judging trajectories on shots from distance, adding another variable to expected goal models.
Documented Case Studies Across Regions
Take matches at Estadio Hernando Siles where home sides recorded a 62 percent win rate over a five-year span ending in 2025, according to aggregated league statistics. Visiting teams averaged 0.8 goals per game versus 1.4 at lower venues, a gap that widened during the acclimatization window of the first 48 hours after arrival. Similar trends appear in rugby tests held in Johannesburg at 1,750 meters, where lineout accuracy and kicking percentages drop for non-acclimated squads.
Baseball offers a controlled comparison through the Colorado Rockies schedule. Home run rates per game sit 25 percent above the major-league average when the team plays at altitude, while road games revert closer to norms. Analysts adjust run-line probabilities accordingly, with totals markets reflecting the historical 11.2 runs per contest at Coors Field versus 8.7 elsewhere.
Adjustments in Result Probabilities
Betting operators incorporate altitude coefficients into their models because raw historical averages fail to capture the interaction between venue height and team preparation. Pre-season training camps held at intermediate elevations have narrowed the performance gap in some instances, yet the effect persists when squads travel directly from sea level. June 2026 schedules include several high-profile fixtures in Andean stadiums, prompting early recalibration of draw and under probabilities based on updated physiological datasets.
Statistical services that supply expected goals and expected points now layer in an elevation multiplier derived from GPS and heart-rate monitoring during actual matches. One analysis covering 180 football fixtures across Bolivia, Ecuador and Peru between 2022 and 2025 found that the probability of a draw rises by 7 percentage points when the visiting side has less than 72 hours to acclimate. Those figures come from aggregated event data rather than subjective judgment.
Regional Regulatory and Research Sources
Health agencies in Australia and Canada have published guidance on altitude exposure for traveling athletes that aligns with findings from South American federations. A 2025 report by the Australian Institute of Sport outlines protocols for monitoring blood oxygen levels that teams now integrate into travel planning. NCAA research on collegiate soccer played at elevation in the western United States similarly records lower shot volumes and higher substitution rates after halftime.
These cross-regional datasets help refine probability estimates because single-league samples often lack sufficient variation in travel distances and acclimatization times. When combined, the patterns become clearer: altitude functions as a consistent modifier rather than a random fluctuation.
Conclusion
Mapping altitude influences requires continuous updates as training methods evolve and fixture calendars shift, yet the underlying physical and physiological relationships remain stable. Leagues operating at elevation continue to generate distinct scoring distributions that data providers and modelers incorporate into forward-looking probabilities. As the 2026 calendar progresses, further matches at notable heights will supply additional observations that refine existing adjustments without altering the core mechanisms already established.